


We are surrounded by high detail images every day. Our cellphones can capture images at 10 megapixels or more, common televisions can stream 4K content, and multi-megapixel CCTV cameras are part of almost every system installed today. These factors can lead some users to expect more detail from their CCTV systems than the system is actually capable of.
In order for our systems to meet the expectations of the users we need to first know what level of detail the user requires, often referred to as “Pixel Density”. As you might imagine, a 4MP (mega-pixel) image sensor looking at an area the size of a postage stamp would capture very high detail. That same sensor mounted high above a large parking lot, looking at an area large enough to hold 500 vehicles would capture very little detail. Calculating which sensor and lens combination is required to deliver the right level of detail, or pixel density, in a given area is the job of the qualified system designer.
The term Pixel Density is defined as parameter which refers to the number of pixels at the object location (focused area), per unit length (pix/m) by the international standard IEC/EN 62676-4:2025 (Video surveillance systems for use in security applications – Part 4: Application guidelines).
PPM and PPF in security industry
Sometimes resolution is confused with pixel density, particularly by users not familiar with CCTV concepts. Resolution describes the total number of pixels in an image, or the total number of pixels of an image sensor. It does not address how many of those pixels are focused on a specific object or area of the image, which is the pixel density.
Specific pixel density levels in CCTV images are referred to as PPM (pixels per meter) or PPF (pixels per foot), depending on the region where the system is being specified. These terms refer to how many pixels of an image sensor would be spread across a 1 meter or 1 foot horizontal measurement in a scene,. You may also come across PPI (pixels per inch) or PPCM (pixels per centimeter) when dealing with specifications for monitors or printers, where the area of the pixels, such as a piece of paper, is much smaller than the area viewed by a typical CCTV camera.
One of the constraints of extracting image detail from a live or recorded video image is that the user is limited by the fact that any detail must be present in the original image.
The image below depicts varying degrees of pixelization. A better method of defining image detail is by pixel density on a target (pixels per foot or pixels per meter).
Pixel density is obtained by dividing the camera horizontal resolution by field of view width.
CCTV system designers tend to use the following categories (from IEC/EN 62676:2015 standard) to describe pixel density levels in an image, in order from most to least detailed:
- Identification
- Recognition
- Observation
- Detection
- Monitoring
The following image shows representative examples of each level:
![]()
Figure 1. Image detail quantified in pixels per meter or pixels per foot (PPM/PPF numbers based on mm per pixel specified by IEC/European Standard EN 62676-4: 2015)
By the way, the newer version of the IEC/EN 62676-2025 standard uses different words: scrutinise, validate, characterise, perceive, discern, outline, overview.
The higher the pixel density, the higher the quality of the picture. With higher pixel density, you can distinguish smaller details.
It is important to note that final image quality is dependent on a number of factors, including available lighting, camera focus, shutter speed, codec compression, and other criteria. Still, without calculating appropriate detail levels for the common scenario we have no hope of delivering a system that meets customer needs.
Pixel Density Calculations
As an example, let’s take a common 1080p camera sensor, which is 1920 pixels wide, and 1080 pixels tall. If we take an area of the image that is approximately 6 meters, or 20 feet, wide we would calculate: 1920px / 6M = 320 PPM, oe 1920px / 20FT = 96 PPF, which would yield a very high detail image, assuming sufficient lighting, focus, etc. If we use the same camera to cover an area 60M/200FT wide, we would have 32PPM / 2PPF, which would only enable us to know that there is general activity in the area, but we would not be able to see specific details about the scene or objects.
Pixel density calculations do not take into account sensor size, or lens parameters, they are a factor of the resolution of the sensor, and the width of the scene. In order to calculate the appropriate lens value for a given sensor resolution and size to meet pixel density requirements is commonly done with CCTV design software or CCTV Lens Calculator, due to the vast number of possibilities available in the market today.
By utilizing software such as our design tool, the system designer can quickly determine the appropriate sensor, lens, and camera position to achieve the desired level of detail for a given camera location. Take for example the following example, based on a Hanwha 1080p dome camera:
![]()
![]()
Both cameras are configured to offer ~60PPF for a target at the leading edge of the red Identification zone. However Camera 2 is placed much closer to the target, as it is using a smaller lens (6mm) vs. the 10mm lens of Camera 1. Both cameras would provide similar levels of detail in that area.
You may also notice that the depth of the various detail zones varies with the lens selected. Larger lenses will provide higher details over longer portions of the field of view than smaller lenses for a given sensor resolution and size. However, you would need more cameras to cover a given area, and the blind spot in front of the camera will be larger with the longer lens camera options. By using our modeling software, designers can quickly visualize and evaluate these trade-offs to find the best camera, sensor, lens, and placement combinations.
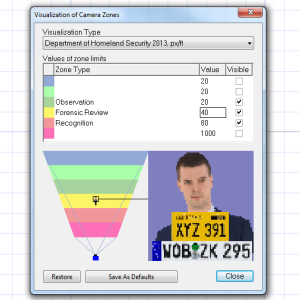
The JVSG design tools will auto-calculate pixel density levels throughout the scene and automatically color-code the camera’s view accordingly. As you are likely already aware, the further the subject is from the camera, the lower the pixel density. Doing these calculations can ensure we can capture adequate detail at expected target locations within the scene.
By default, the IP Video System Design Tool shows camera zones according to international / European Union standard IEC/EN 62676-4: 2015 (and older EN 50132-7). Part 4 of that standard covers the different operator’s tasks, including monitoring, Detection, Observation, Recognition, and Identification (DORI). The new standard IEC/EN 62676-4:2025 is also supported and uses different zones: Overview, Outline, Discern, Perceive, Characteride, Validate, Scrutinise (OODPCVS).
![]()
Because a calculated PPM/PPF value only exists at a specific point in the image, these values are often expressed rounded to the nearest 10’s or 5’s value, eg: 40PPF, 125PPM, 90PPM, etc. In some cases they may be used to indicate a best case scenario, representing a location closest to the camera, or in other cases they may be used in a worst case scenario, representing a location furthest from the camera, which would indicate that subjects closer to the camera would have even more detail. It is important to understand customer expectations for detail levels, and to explain accordingly what to expect throughout the field of view of the camera. The JVSG Design Tool can auto calculate these values for any portion of the image, and allows you to place multiple sample targets, with the software showing a rendering of what an average face or license plate would look like in that portion of the image:
![]()
By understanding pixel density you can better convert customer requests, such as “I’d like to capture license plates at this location” or “I’d like to be able to tell if my workers are wearing hard hats” to specific design criteria, such as camera location, resolution, and lens parameters to deliver a system that meets their expectations without costly change orders or guesswork.
DORI Zones
![]()
DORI stands for Detection, Observation, Recognition, Identification. You can use IP Video System Design Tool or online Pixel Density Calculator to see DORI zones.
Identification: The first type of camera zone is the identification zone. In the program, this is marked in red. In this area, you can positively identify a person beyond reasonable doubt. Here we have sufficient picture quality and detail to identify an individual. The EU standard defines the identification area as “more than 4mm at the target distance per pixel”. If we covert 4mm per pixels to pixel density (1000mm divide by 4 mm per pixel), the result is 250 pixels per meter (PPM) or about 76 pixels per foot (PPF).
Recognition: The second zone is recognition, marked in yellow. In this area, the security operator will be able to recognize a person known to them. Viewers can verify with a high degree of certainty whether or not an individual shown is the same as someone they have seen before. In this area, the pixel density is not less than 125 PPM (38 PPF) or 8mm per pixel. Also in this area, it is possible to recognize license plates manually, but the camera resolution maybe not sufficient for Automatic number plate recognition (ANPR) systems.
Observation: Next we have the observation zone (green). In this area, some characteristic details of the individual, such as distinctive clothing, can be seen. The pixel density is 62 pixels per meter or about 19 PPF (16mm per pixel by EN 62676-4)
Detection: Next is the detection zone (light green). In this area, where the operator will be able to detect a human presence: 25 PPM or 8 PPF (40mm per pixel).
Monitoring: The monitoring zone (blue) is used to monitor or perform crowd control. 12PPM / 4 PPF/ 80mm per pixel.
There is also a special kind of zone called Inspection or Strong Identification: 1000 PPM or 303 PPF (or 1mm per pixel by EN 62676-4), marked as purple in the program.
Figure 2. shown above depicts the difference in image detail at various levels from 4 pixels per foot (12 pixels per meter) to 76 pixels per foot (250 pixels per meter).
It can be a time-consuming task to find available camera resolution and lens combinations for the required pixel density if done manually.
This task is automated with the IP Video System Design Tool, which has an integrated pixel density calculator that calculates the pixels per foot or per meter and illustrates the detail level with color-coded (red, yellow, green, blue) areas. Apart from IP Video System Design Tool you can also use our online PPF PPM Calculator here.
Part 2: Pixel density, camera zones, identification, recognition, detection and EN 62676-4: 2015
![]()
Figure 3. Camera Coverage illustration
There are other standards that are supported by the IP Video System Design Tool.
See also: Pixel Density Calculator
Department of Homeland Security 2013 (DHS 2013) Recommendations
Department of Homeland Security 2013 (DHS 2013) published its own recommendations for pixels per foot for different video surveillance functions in the Digital Video Quality Handbook (pages 27-28).
1. Observation: 20 PPF
2. Forensic review: 40 PPF
3. Recognition: 80 PPF
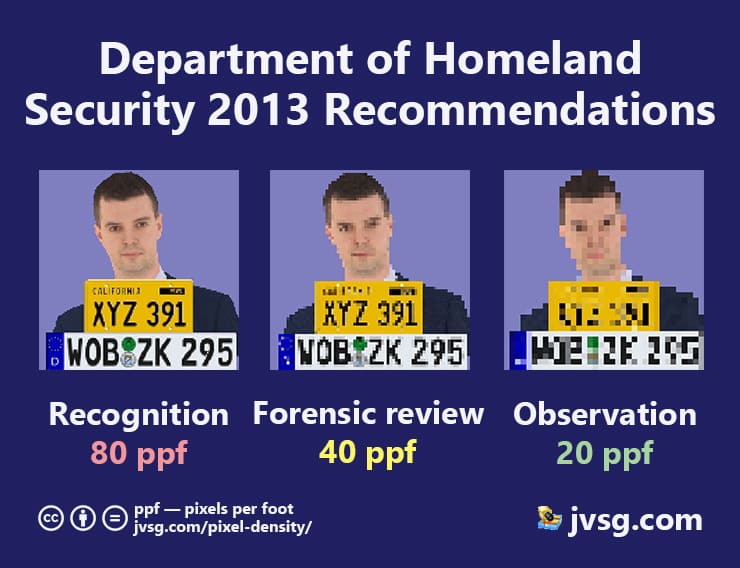
We can see that the DHS Observation: 20 pixel per foot zone is close to EU Observation: 19 pixel per foot zone (or 16mm per pixel by EN62676-4), but 80 PPF of the DHS Recognition zone is closer to the European EN Identification zone.
IEC 62676-4: 2025
Here are pixel density values introduced by IEC 62676-4: 2025 standard.
1. Overview: 20 ppm
2. Outline: 40 ppm
3. Discern: 80 ppm
4. Perceive: 125 ppm (PPM value is equal to the previous Recognition)
5. Characterise: 250 ppm (PPM is equal to previous Identification)
6. Validate: 500 pixel/metre.
7. Scrutinise: 1500 ppm
These pixel density numbers are supported by JVSG Design Tool version 2025.
![]()
Pic. 2 Representation of pixel density of Overview, Outline, Discern, Perceive, Characterize, Validate, Scrutinize camera zones (operator tasks) in video surveillance based on IEC 62676-4:2025 standard.
The picture above is licensed under Creative Commons license, do not modify.
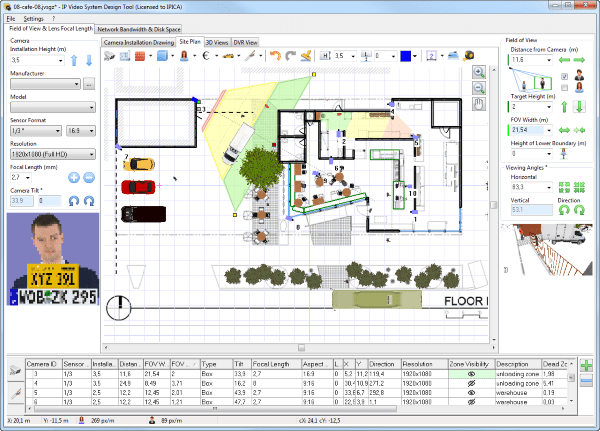
Site Plan, Floor Plan, and Obstacles
A site/floor plan can be loaded from a file or created in the JVSG Design Tool software using objects such as walls, boxes, doors, windows, fences or stairs. The user can add test people, cars, trees, furniture, and other test objects.
![]()
By positioning all of these objects and viewing your site plan, you can decide where to locate and how to position your cameras.
On the next 3D View tab of the IP Video System Design Tool, you will see the Camera 3D View enlarged.
Using your mouse, you can adjust the camera direction and position.
![]()
Figure 4. Computer simulation of image size on screen
Conclusion
PPM and PPF are popular metrics in the video surveillance industry.
The IP Video System Design Tool software performs pixel density calculations and allows the use of customer-provided site plan drawings (PDF files, JPEG/PNG images, and AutoCAD DWG drawings) to find optimal camera locations, camera resolution,field of view and lens focal length.
We can also create a virtual working space with objects such as walls, people, cars and trees that make sense to our customers. Thus, we can show clients a schematic layout which is very similar to the real world as they evaluate whether the proposal is acceptable.
A trial version of IP Video System Design Tool can be downloaded from jvsg.com.

Video tutorials are here and here. An youtube visual explanation of EN64676 (EN50132-7) operator tasks is here.
on 17th of March 2025